

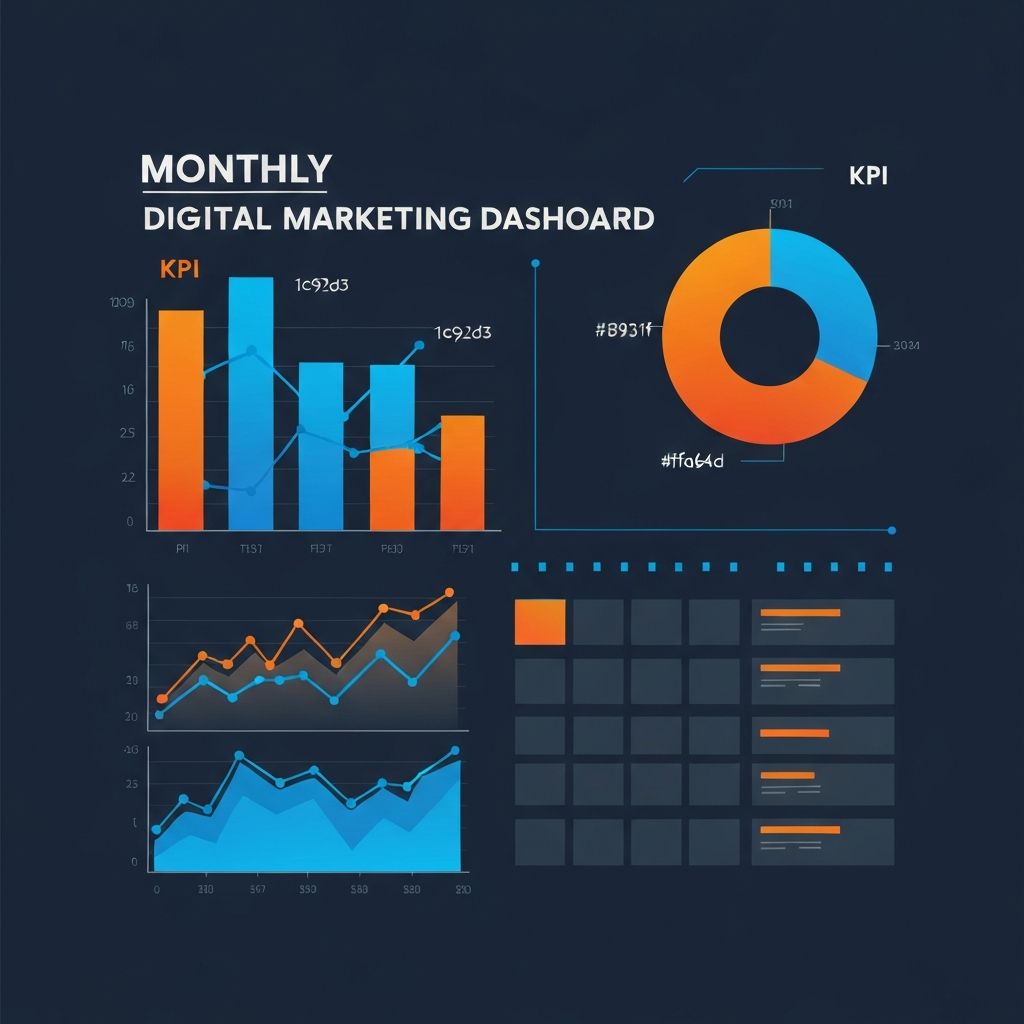
Monthly Digital Marketing Report Template
Why Monthly Reporting Is the Backbone of Digital Marketing
Marketing without reporting is like driving with your eyes closed. A well-structured monthly report transforms raw data into a clear narrative about progress, performance, and next steps. At AAMAX.CO, we have refined our reporting process over hundreds of client engagements, and we believe a strong template is the difference between dashboards that confuse and reports that inspire action.
Whether you manage marketing in-house or outsource it to an agency, a consistent monthly template keeps everyone aligned. It clarifies what success looks like, exposes weaknesses early, and builds trust between marketing teams and executive stakeholders.
Core Sections Every Monthly Report Should Include
Our recommended template covers seven key sections that move from high-level summary to granular detail.
1. Executive Summary
Begin with a one-page overview that captures the month's biggest wins, biggest concerns, and most important next steps. Executives may not read the rest, so this section must stand alone.
2. Goals and KPIs
List the goals defined at the start of the quarter or year, alongside current performance versus target. Use simple visuals like progress bars or traffic-light indicators so anyone can scan the section in seconds.
3. Traffic and Audience
Break down sessions, users, and pageviews by channel: organic, paid, social, email, direct, and referral. Comment on month-over-month and year-over-year trends. This is also where strong digital marketing programs reveal compounding gains.
4. SEO Performance
Cover keyword rankings, organic impressions, click-through rate, top-performing landing pages, and backlinks earned. Highlight technical fixes shipped during the month and their measurable impact. Strong SEO services show up in this section as steady upward momentum.
5. Paid Media
Detail spend, impressions, clicks, conversions, cost per acquisition, and return on ad spend across each platform. Include creative performance notes and bid strategy adjustments.
6. Social and Content
Track follower growth, engagement rate, top posts, and content publishing cadence. Show how social campaigns ladder up to the broader business goals.
7. Recommendations and Next Steps
End with a forward-looking section. What experiments will run next month? What budget shifts are recommended? What questions need stakeholder input?
Designing the Report for Clarity
Great reports are visual, scannable, and honest. Use consistent colors, simple charts, and minimal jargon. Every chart should answer a specific question. Avoid the trap of vanity metrics; report only what informs decisions.
We recommend distributing the report as a PDF or shared online dashboard, paired with a short video walkthrough or live meeting. The video personalizes the data and gives stakeholders a chance to ask questions in real time.
Tools That Power Modern Reporting
You no longer need to copy and paste numbers from ten different dashboards. Tools like Looker Studio, Databox, and Supermetrics pull data automatically from Google Analytics, Search Console, Meta, LinkedIn, and ad platforms. Once configured, your monthly report can be largely automated, freeing your team to focus on insights instead of data wrangling.
Common Reporting Mistakes to Avoid
- Drowning in metrics: A report with 50 KPIs hides the few that actually matter.
- No context: A 20 percent traffic drop is alarming until you note that a major holiday fell on a weekday last year.
- No recommendations: Data without action is just trivia.
- Inconsistent format: Different layouts each month make trend spotting impossible.
How AAMAX.CO Builds Custom Reports for Clients
Every business has unique goals, so we tailor templates to each client. For e-commerce brands we emphasize revenue, AOV, and ROAS. For service businesses we focus on lead quality, cost per qualified lead, and pipeline contribution. We also integrate Google ads data alongside organic and social channels for a holistic view.
Our reports are paired with strategic digital marketing consultancy sessions, where we walk through findings and align on the path forward. This combination of data plus expert interpretation is what turns reports into growth engines.
Sample Monthly Report Outline
Use this skeleton as a starting point and customize it for your business:
- Cover page with month, brand, and report owner.
- Executive summary with three to five highlights.
- KPI scorecard table.
- Channel-by-channel performance breakdown.
- Campaign deep dives.
- Conversion funnel analysis.
- Competitor or industry benchmarks.
- Action items for the upcoming month.
Make Reporting a Strategic Advantage
Reports are not bureaucratic overhead; they are leadership tools. Done right, they create a shared language between marketers and the rest of the business, surface opportunities, and accelerate growth. Hire AAMAX.CO if you want a partner who treats reporting as seriously as execution and helps you turn every monthly review into a moment of strategic clarity.
Want to publish a guest post on aamax.co?
Place an order for a guest post or link insertion today.
Place an Order