

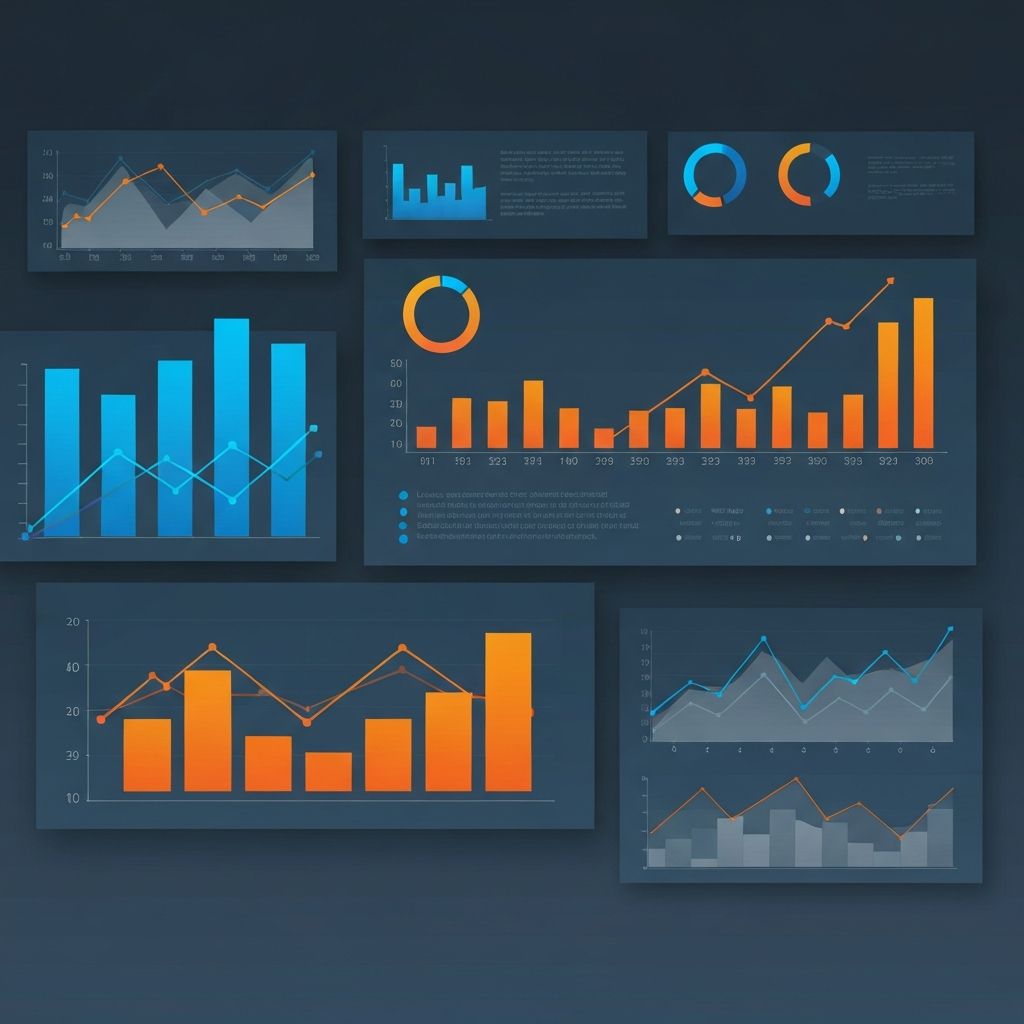
Digital Marketing Reports Dashboard
The Power of a Centralized Reports Dashboard
Modern marketing campaigns run across many platforms simultaneously, and each platform has its own reporting interface. Logging into ten different tools every week is exhausting and inefficient. A digital marketing reports dashboard solves the problem by pulling all data into one place. At AAMAX.CO, we design centralized dashboards that save our clients hours every week and reveal insights that scattered reports miss.
Defining Goals Before Building
Before designing any dashboard, you must define what success looks like. Is the goal to increase sales, generate qualified leads, grow brand awareness, or improve customer retention? Each goal requires different metrics. A lead generation business may focus on cost per lead and conversion rate, while an ecommerce store may prioritize return on ad spend and average order value. Without clear goals, dashboards become noise.
Layering Metrics for Different Audiences
A great dashboard serves multiple audiences. Executives want a high-level view of revenue, growth, and ROI. Marketing managers want channel-level performance and trend analysis. Specialists want granular data on keywords, ads, and creative performance. The best dashboards layer these views, allowing each user to find what they need without distraction.
Connecting Data Sources
Building a strong reports dashboard requires connecting multiple data sources. Google Analytics tracks website behavior. Google Ads and Meta Ads provide paid performance data. CRM systems track leads and revenue. SEO tools provide ranking and backlink data. Email platforms supply campaign metrics. Connecting these sources properly is the technical heart of dashboard building, and it requires expertise in APIs, data modeling, and integration tools.
Visualizing Trends, Not Just Numbers
Numbers alone rarely tell the full story. Trends are what reveal opportunities and risks. A dashboard should show how metrics change over time, how they compare to previous periods, and how they perform against targets. Color-coded indicators, sparkline charts, and trend lines help users interpret information quickly without needing to study tables of raw numbers.
Automating Insights and Alerts
Modern dashboards do more than display data; they generate insights automatically. Alerts can flag sudden drops in traffic, spikes in cost per click, or anomalies in conversion rates. Some platforms use AI to suggest optimizations based on patterns. These features turn dashboards from passive reports into active assistants.
Reports That Drive Action
The ultimate purpose of any dashboard is to drive better decisions. Every metric should be tied to an action. If organic traffic is down, the team adjusts the SEO strategy. If a campaign is overspending, the budget is reallocated. Without action, even the most beautiful dashboard is just a screensaver. We make sure every report we deliver includes clear recommendations and next steps.
Maintaining and Improving Dashboards
Dashboards are not static. They evolve as your business grows, new channels emerge, and goals shift. Regular reviews ensure they continue to serve your needs. We work with clients to refine dashboards every quarter, removing metrics that no longer matter and adding new ones that reflect emerging priorities.
Build a Smarter Reports Dashboard
If you are ready to upgrade your reporting and unlock the full potential of your data, hire AAMAX.CO. We are a full service digital marketing company offering web development, digital marketing, and SEO services worldwide. Let us help you turn information into intelligence and intelligence into growth.
Want to publish a guest post on aamax.co?
Place an order for a guest post or link insertion today.
Place an Order